

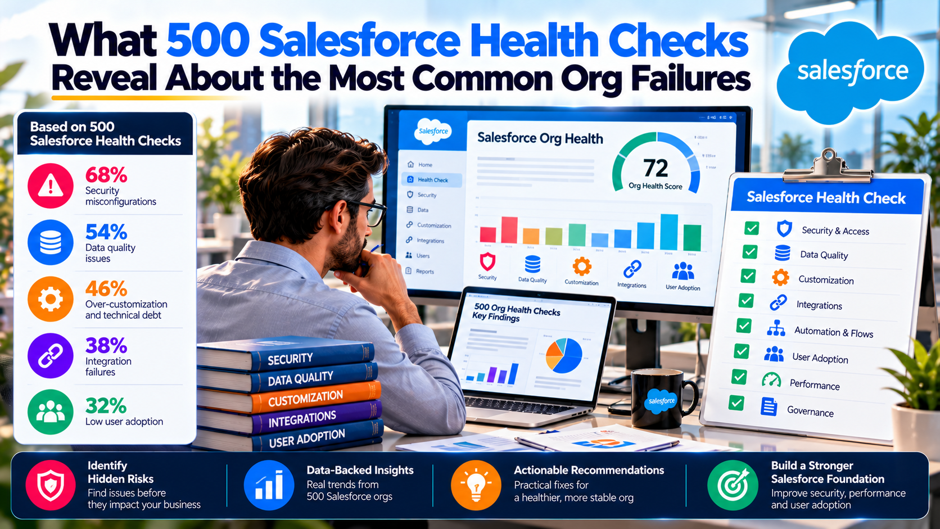
Here’s an invented scenario to frame the topic. A fictional 1,200-user manufacturer, unconnected to any real company, asks a consultant for a Salesforce health check. The consultant says the findings come from “hundreds of audits” and lists the usual suspects: too many admins, duplicate contacts, old automation, idle licenses. The operations director asks the obvious question: how many orgs, measured how, and how often did each problem appear? The consultant has no answer. This post starts from that question, because the title above promises more than any source I could find delivers.
Scope and caveats come first, and the first is unusual. I didn’t find, run or receive a dataset of 500 health checks, and nothing I read reports such a dataset, so the 500 in the title isn’t backed by data. What I did read were 13 pages, made up of 2 from Salesforce, 6 from consultancies and audit-tool vendors, 2 from a data-quality vendor, 1 from a DevOps vendor and 2 on security exposure. Their sample sizes range from 300 to over 10,000, and several give none. Everything below is a synthesis of those pages, labeled as such. Confirm any figure with its source before you repeat it.
TL;DR
- The 500 isn’t evidence I could find. The only measured samples I read were about 300 organizations in a 2020 data survey, over 10,000 orgs in a data-quality vendor’s record analysis and 1,296 respondents in a DevOps survey. A tool vendor’s claim of 1,000+ audits came with no method. No source counted how often each org failure appears across audited orgs.
- A trio of failures top every audit list. By my tally of 6 audit pages, access and permission sprawl, duplicate or incomplete data and old or overlapping automation were each named by all 6. A mention isn’t prevalence, and none of the pages said how many orgs it saw each problem in.
- Data quality is the best-measured failure. A vendor reports that 81% of records in a single subset needed improvement and 47% of lead and contact emails were invalid or risky. A 2020 survey of about 300 organizations found 95% reported at least some data quality issues. Both come from vendors that sell data tools.
What the numbers behind the title look like
The table lists every sample size or audit count I found, with what was measured and how much weight it deserves. I checked each against the page it came from. The pattern is clear: the larger the number, the less it says about org health checks, and the closer a source comes to health checks, the less it tells you about the method. Nothing in the table is a count of audited orgs with findings tallied, which is what the title implies.
| Source | Size claimed | What was measured | Weight |
| Data-quality vendor’s record analysis | 264 billion records, over 10,000 orgs | Duplicates, missing fields, invalid data on 4 standard objects | Large, vendor-run, undated |
| Same vendor’s 2020 survey, republished by a community site | About 300 organizations | Self-reported CRM data quality practices | Self-reported |
| DevOps vendor’s 2024 survey | 1,296 professionals | Release practices, version control, backups | Vendor survey, method not described |
| Audit-tool vendor’s guide | “1,000+ org audits” | Not stated | Unsupported |
| Security journalist’s 2023 report | “Hundreds” of misconfigured public pages | Guest access on public sites | A single researcher’s program |
| Consultancy and agency blogs | None | Lists of common findings | Experience claims |
| A set of 500 health checks | None found | Not applicable | Not available |
How to read a claim like this
Any claim of the form “we reviewed N orgs and found X” deserves the same short list of questions. The list below is my own, built from what the pages did and didn’t say. It’s useful whether the claim comes from a vendor, a consultancy or a blog, and it’s the reason I used no percentage here that lacked a stated source. Apply it to the figures in this post as well.
- Who was in the sample? Orgs that buy health checks aren’t a random draw of orgs. A consultancy sees clients who already suspect a problem, and a tool vendor sees customers who chose its tool. A 2020 data survey in my set came from a vendor’s audience plus its own user base, which tilts toward people who care about data tools. Ask how the vendor chose which orgs to include, and whether that choice was made before or after the results.
- What counts as a failure? A single firm’s finding is another’s accepted trade-off. Several pages treat leftover legacy automation as a failure, while another lists it as a cleanup item. If a source doesn’t define its terms, a percentage can’t be compared with anyone else’s. Ask for the written definition and the exact test behind each count, such as how many days of inactivity make a license idle, and compare it with your own definition.
- When was it measured? A data-quality page carries no date, and a consultancy’s blog shows a byline from 2025 and a metadata update from 2026. Platform defaults and end-of-support dates change, so a finding that was common in 2020 may be rarer or worse now. Ask for the date range of the data, and whether the platform changed during that period in ways that affect the finding. Record the answers beside the figure.
- Who benefits from the answer? Most pages end in an offer: a free review, a trial, a consultation. That doesn’t make them wrong, but it explains why they list many findings and few reassurances. Ask what the author would lose if the number were lower. A reviewer who sells remediation has a reason to find more, and a tool vendor has a reason to find what its tool fixes. Read the claim with that incentive in mind.
The failure on every list: access sprawl
Permission sprawl leads almost every list I read. Cloud Nexus, a consulting firm, lists stacked permission sets that add up to de facto admin access as its first finding. Codiot asks whether access follows a maintainable permission-set model or years of single-purpose profile edits. Minuscule Technologies describes permission creep and stale OAuth tokens from old integrations. Domestique calls permission sprawl among the most common findings in fast-growing orgs, without a source. Client tell’s guide flags Modify All Data and View All Data grants that have no named owner.
None of these pages says how many orgs had the problem. Cloud Nexus offers an unsourced figure that a permissions cleanup consolidates 40% to 60% of stacked permission sets, which is a claim about what a cleanup achieves rather than about how common the problem is. Salesforce’s Trailhead describes its Health Check as a dashboard scoring security settings from 0 to 100 against Salesforce’s recommended values, and it doesn’t count users or permissions. So the claim that access sprawl is the most common failure rests on agreement among sellers, not on a measured rate. Agreement among sellers is still a reasonable reason to check it first, because the check is cheap.
The failures and how often the pages name them
The table tallies how many of the 6 audit pages named each failure, by my reading of the lists each page gave. I treated the Clientell org audit page as a list of review areas, since it names areas rather than findings. A mention is a vote for relevance, not a measurement of how often the failure occurs. I added the other evidence I found for each row so you can see where numbers exist and where they don’t.
| Failure | Audit pages naming it (of 6) | Other evidence | Quality |
| Access and permission sprawl | 6 | None with a rate | Opinion |
| Duplicate or incomplete data | 6 | Vendor record analysis, 2020 survey | Vendor data |
| Old or overlapping automation | 6 | Vendor dates for retired tools | Opinion, secondhand dates |
| Unmonitored or unowned integrations | 4 | None | Opinion |
| Unused licenses | 4 | An unsourced range of inactive users | Unsourced |
| Weak custom code and limits | 4 | None | Opinion |
| Clutter and technical debt | 3 | An unsourced object count range | Unsourced |
| Low adoption | 3 | None | Opinion |
| Guest and public exposure | 1 | Salesforce guidance, a news report, a vendor post | Strong on existence |
| Missing backups | 1 | A DevOps vendor survey on backup plans | Vendor survey |
Data quality: the best-measured failure
Scale. A data-quality vendor reports analyzing 264 billion records from over 10,000 orgs, covering accounts, contacts, leads and opportunities. It says 81% of records assessed need improvement, but that figure draws on a subset of over 35 million records from orgs that hadn’t invested in a data management tool, so it isn’t an average of all orgs. It also says only 31% of lead records had complete engagement data and that 47% of lead and contact emails were invalid or risky, split into 13% invalid and 34% risky.
Survey view. A 2020 survey republished by a community site covered about 300 organizations. It reports that 95% had at least some CRM data quality issues, that missing or incomplete data was the most common at 69%, that duplicate and incorrect data were each reported by about half, and that expired data was reported by 41%. It adds that a third of respondents had no data management process or an ineffective process, and that 44% estimated a revenue loss from poor data, ranging from 5% to 20%.
What it suggests. Organizations with a full-time data owner were twice as likely to rate their data quality good or very good, and organizations with nobody responsible were 5 times more likely to rate it poor. Those are self-ratings from a vendor’s audience, so they show a pattern rather than a proof. Still, ownership is a cheap thing to check in any org. Ask who owns data quality in your org today and whether that person has time.
Limits. The record analysis page is undated, describes no sampling method and promotes the vendor’s tool. The survey is more than 5 years old and its question wording isn’t shown. Neither reports a duplicate rate for all orgs, which is the number most people want. Treat the vendor figures as evidence that data problems are common, not as a rate for your org. Ask the vendor for the method behind any rate you plan to quote.
Automation that nobody retired
Old automation shows up on all 6 audit lists, though the exact complaint varies. The list below separates the complaints, since each needs a different fix. Several pages say Workflow Rules and Process Builder still run beside newer tools, and a single page gives end-of-support dates that it attributes to Salesforce Help, which I didn’t read. Its date format is ambiguous, so I won’t repeat the dates here. Check Salesforce’s current documentation for what’s supported in your org.
- Overlapping tools on a single object. Codiot lists workflow rules, Process Builder and Flow doing similar work on the same object, and Cloud Nexus describes legacy automation still running alongside Flow. The risk is that nobody can say which rule changed a field. Start by listing, for your 5 busiest objects, every automation that fires on save, then retire the ones that duplicate another. Document what you retired, why, when and who approved it.
- Order of execution. Codiot says automation fires in an unplanned order on some objects, so results are sometimes inconsistent. Inconsistent results are hard to reproduce, which makes them expensive to debug. Ask your admin which objects have more than 1 kind of automation, and test a few records in a sandbox with logging turned on. Keep a short note of the order you find, because the next admin will need it.
- Silent failures. Codiot says a silent failure is far more expensive than a visible error, and Clientell’s guide flags failed flow interviews and nobody set to receive flow error emails. A flow that fails without notice can leave records half updated for weeks. Check who gets the error emails today, and whether that person still works at the company. Send error emails to a shared mailbox rather than a single person.
- Validation rules that clash. Cloud Nexus lists older and newer validation rules that block legitimate work. Minuscule describes conflicting flows and retired Process Builder logic. Ask users which screens give them errors they can’t explain, and trace each to a rule. Keep a list of every rule that has blocked a legitimate save in the past 90 days, with the date and the user affected. Review the list monthly, and retire rules that nobody can explain.
Integrations and silent failures
Integrations fail quietly. Cloud Nexus lists integration latency that nobody monitors, with failures surfacing weeks later, and puts the number of active integrations in a typical org at 5 to 15, with no source. Minuscule describes brittle integrations and stale tokens from old ones. Codiot asks what connected apps and integration users can reach and whether they still need it. Client tell’s guide flags connected apps with no owner and integration users that log in as real people. These are 4 views of a single problem: nobody owns the connection after the project ends.
I found no measured rate for any of this, and no source reported how long failed syncs go unnoticed. The cheapest check is a register: list every integration, its owner, its direction of data flow, the user account it runs under and what alert fires when it fails. An integration without an owner or an alert is the finding. Cloud Nexus puts the 5 to 15 range in print, but treat it as an anecdote and count your own, including the ones a former employee set up.
Public exposure through guest access
What Salesforce says. A Salesforce security post from March 2026 lists misconfigurations on sites that use the guest user profile: permissions that expose objects and fields not meant to be public, public APIs reachable by guests, external access defaults not set to private, visibility settings that let guests enumerate members, unneeded self-registration and field-level security that’s too broad on contacts, leads and cases. It calls turning off public API access the highest-impact single change and gives no statistics.
What outsiders found. A 2023 report by a security journalist says a researcher’s program identified hundreds of other organizations running misconfigured pages, with exposed data in examples including Social Security numbers and bank account numbers. Salesforce’s response in that report was that the exposures weren’t the result of a vulnerability in the platform but of customers’ access settings. A 2023 post from a security vendor, republished by an industry association, makes the same point and says the configuration and security of the tenant remains the customer’s responsibility.
What to check. Start with every site that allows guest access. For each, review the guest profile’s object and field permissions, the external sharing defaults, the guest sharing rules and whether API access for guests is on. Salesforce’s post suggests reviewing event logs for queries against non-public objects. Treat this as the lone failure on the list where the consequence is publicly documented, even though I found no rate. Record the date you checked.
An invented cost sketch for a mid-size org
Everything in this section is invented, and I recomputed it in code. Assume a 1,200-user org where 20% of seats are inactive, a figure I picked from inside an unsourced vendor range of 15% to 25%. At an invented $100 per seat per month, 240 idle seats cost $24,000 a month, or $288,000 a year. Now assume 500,000 contacts with a 10% duplicate rate, again inside an unsourced range of 5% to 15%. That’s 50,000 duplicates. The table shows what manual review costs against matching rules that merge most of them.
| Item | Amount | Note |
| Users | 1,200 | Invented |
| Inactive share of seats | 20% | Invented, within an unsourced vendor range |
| Idle seats | 240 | Computed |
| Seat price | $100 per month | Invented |
| Idle seat cost per year | $288,000 | Computed |
| Contacts | 500,000 | Invented |
| Duplicate rate | 10% | Invented, within an unsourced vendor range |
| Duplicate records | 50,000 | Computed |
| Manual review at 2 minutes each | 1,667 hours | Computed |
| After rules merge 70% automatically | 500 hours | Invented merge rate |
The sketch shows scale, not truth. License cost depends on the contract, and a seat counted inactive for 90 days may belong to a seasonal user. Duplicates vary by object. If you want a real figure, run the login and duplicate reports in your own org this week. Nothing in my sources supports the 20%, the 10%, the $100 or the 70%, so replace each with your numbers before showing the sketch to anyone who funds the cleanup.
Code, limits and the cost of cleanup
Custom code failures are the most technical on the list, and the least measured. Codiot lists Apex written to pass deployment rather than prove behavior, hardcoded IDs that break between environments, queries and loops that work at current volume but fail at higher volume, and code that Flow now handles natively. Minuscule describes queries or data operations inside loops that hit governor limits and says to process records in batches. Clientell’s guide lists failing tests. All 3 are practitioner descriptions, and none gives a rate.
The nearest thing to data is a DevOps vendor’s 2024 survey of 1,296 professionals. It reports 73% saying changes are built and deployed uniformly, 86% having adopted or planning to adopt version control, 81% using continuous integration and delivery, and 11% still reporting significant issues with bugs and errors. It gives no figure for technical debt. The vendor sells DevOps tools and doesn’t describe its method, so the numbers describe a motivated audience. They hint that many teams have processes but also that some orgs have none.
Tools you can run yourself, and what each costs
Several checks cost nothing. The list below covers what the pages say is available and what’s quoted for paid help. Prices come from vendors, mostly without sources, and I didn’t verify any. Salesforce’s own documentation should be your reference for what each tool does in your edition. Start with the free tools, since they also give you a baseline against which to judge any paid review. Run each in a sandbox first.
- Built-in security Health Check. Salesforce’s Trailhead describes a Setup dashboard that scores security settings from 0 to 100 against standard values, with a Fix Risks button that changes flagged settings at once and may affect integrations or user access. It recommends changing settings individually and testing in a sandbox. You can upload your own baseline, which it suggests for regulated industries. Security Center is a separate add-on for multiple orgs.
- Other free tools. Clientell’s guide lists Setup Audit Trail, Org Check and Salesforce Code Analyzer as free, and says an older Salesforce org review tool is retired for orgs created after a date written as 04-08-2025. Because the format is ambiguous, check the retirement details in Salesforce Help. I didn’t verify the tool descriptions, so test each in a sandbox. Record the version and date of each run you make.
- Paid reviews. Cloud Nexus lists price ranges of $3,000 to $8,000, $8,000 to $20,000 and over $30,000 for health checks of increasing depth, with no source. Clientele lists managed services from $3,500 a month. Both are vendors, so use the numbers to sanity-check a quote, not to budget. Ask each firm to explain what the price includes, how long the work takes and whether remediation is billed separately from the assessment. Compare at least 3 quotes.
- What a paid review should add. Several pages say the useful output is a prioritized plan rather than a list of issues. Ask for findings ranked by risk and effort, with owners and dates, and ask the reviewer how many comparable orgs the ranking draws on, and how they measured it. Ask for a sample report from a past engagement with client details removed, so you can judge the depth before you pay.
Adoption, backups and the problems outside the settings
Adoption pockets. Cloud Nexus says healthy org-wide login rates can hide low usage on individual teams, and gives a 90% org-wide example as an illustration. Domestique recommends checking adoption by talking to users and looking at low field usage, unopened dashboards and workarounds outside Salesforce. Minuscule lists cluttered pages and thin training. No page measured adoption, so the evidence is anecdotal. The practical check is to compare logins and record edits by team, then ask the lowest team why.
Backups. Cloud Nexus lists no automated backups as a finding, saying teams assume Salesforce handles backup but native recovery is limited. I didn’t verify the recovery claim against Salesforce documentation. The DevOps vendor’s survey says 87% back up their orgs or plan to in 2024, which suggests planning a backup is common and says little about who actually has a backup running. Ask which backup exists, who tested a restore and when.
Ownership. The 2020 data survey is the only source that tied a measurable outcome to ownership, with organizations that have a full-time data owner twice as likely to rate quality goods. Several audit pages end by recommending a named owner for each integration, report folder and permission set. Ownership costs little, but it needs someone with authority to assign it, which is why it often doesn’t happen. Write the owner’s name next to each asset.
What the sources don’t tell you
Several gaps limit everything above. First, no source tallied findings across a named set of audited orgs, so I can’t say what share of orgs have any failure, let alone the most common failure. Second, the larger samples come from vendors whose methods aren’t described, and the audit pages are marketing for audit services. Third, I read no Salesforce documentation on current limits or retirement dates, so any date or limit I mention is secondhand and flagged.
Sources also conflict or carry errors. A vendor’s guide cites a survey that 60% of admins were considering a non-admin role, but its own link slug says 60% are planning to leave, and I couldn’t read the survey. An agency blog says it was written with AI assistance. Another lists sources at the end that it doesn’t tie to any claim. Date formats are ambiguous in several places. Cloud Nexus lists many ranges and no method, so I treated them as a single firm’s rule of thumb. Where a pair of sources disagree, I went with the source that showed its work.
What a 500-org sample could tell you
Suppose someone did run 500 health checks and tally the findings. The table shows how precise the percentages would be if the sample were random, using the standard 95% margin for a proportion. The math is mine, and it assumes random sampling, which health check clients aren’t. Real clients choose to be audited, so any tally from them would overstate problems that prompt audits and miss problems nobody notices. Margins also say nothing about how findings were defined.
| True share of orgs with a finding | Margin with 300 orgs | Margin with 500 orgs | Margin with 1,000 orgs |
| 5% | plus or minus 2.5 points | plus or minus 1.9 points | plus or minus 1.4 points |
| 20% | plus or minus 4.5 points | plus or minus 3.5 points | plus or minus 2.5 points |
| 50% | plus or minus 5.7 points | plus or minus 4.4 points | plus or minus 3.1 points |
Read the table in 2 ways. A real 500-org tally could separate a 20% finding from a 50% finding easily, so ranking failures by prevalence is feasible with that size. But it couldn’t tell you whether your org looks like those orgs, which is the question that matters. A modest sample of orgs like yours, defined by size, industry and age, would answer it better than a large mixed sample. If a vendor offers a tally, ask for the sample’s makeup before the sample’s size.
A 4-week plan to run your own check
Week 1. Pick an owner and list what you’ll measure: users and last login, permission sets and who holds powerful permissions, integrations and their owners, active automation by object, duplicates by object and guest-accessible sites. Run the built-in security check and export the results. My suggestion, not a sourced benchmark: keep the first week to counting, with no fixes, so you’ve got a baseline. Save every export with its date and the person who ran it.
Week 2. Rank what you found by risk and effort. Put guest exposure and powerful permissions first, since the consequences there are documented and the checks are quick. Put automation cleanup and duplicates next, since they affect daily work. My suggestion, not a sourced benchmark: fix the top 3 items in a sandbox first and test with a few real users before touching production. Agree the ranking with the business owner before work starts.
Weeks 3 and 4. Make the changes in order, individually, and record each change with the reason, the date and the person who approved it. Rerun the measurements from week 1 and compare. My suggestion, not a sourced benchmark: expect the data cleanup to take the longest, and don’t promise a date until you’ve measured the duplicate count and the merge rules. Keep the old and new settings side by side in a document, so a change can be reversed quickly.
Report and repeat. Write a short report with the before and after numbers, the items you deferred and the owners. Then schedule the next check. Sources disagree on frequency, and the recommendations I saw (once a year, or every 2 to 3 years for simple orgs) had no cited basis. Pick a cadence your risk tolerance supports, and trigger an extra check after major changes such as an acquisition or a large integration.
FAQs
Is there really a dataset of 500 Salesforce health checks?
I didn’t find such a dataset. I read 13 pages, and none reports a tally of findings across 500 audited orgs. The closest samples were about 300 organizations in a 2020 data survey, over 10,000 orgs in a data-quality vendor’s record analysis and 1,296 respondents in a DevOps survey, and none of them tallied health check findings. A vendor claims 1,000+ audits without a method. If someone quotes 500, ask for the sample and method.
What are the most common Salesforce org failures?
By my tally of 6 audit pages, access and permission sprawl, duplicate or incomplete data and old or overlapping automation were each named by all 6. Unmonitored integrations, unused licenses and weak custom code were named by 4. A mention isn’t prevalence, and no page said how many orgs had each problem. Use the list as a set of checks, and measure your own org. Use that as a checklist, not a ranking.
How bad is Salesforce data quality in practice?
Vendor sources suggest it’s often poor. A vendor reports 81% of records in a subset of orgs without a data tool needed improvement and 47% of lead and contact emails were invalid or risky. A 2020 survey of about 300 organizations found 95% reported some issues, with missing data the most common at 69%. Both come from vendors that sell data tools, and neither gives a rate for all orgs.
Are guest user misconfigurations a real risk?
Yes, and it’s the best-documented security failure in my set. A 2023 news report describes a researcher finding hundreds of organizations with misconfigured public pages, with exposed data including Social Security numbers in examples. Salesforce’s March 2026 post lists the settings to review and calls turning off public API access for guests the highest-impact single change. Review every site that allows guest access, and confirm settings with your security team.
What does the built-in Health Check measure?
Salesforce’s Trailhead describes a Setup dashboard that scores your security settings from 0 to 100 against Salesforce’s recommended values, with a Fix Risks button that changes flagged settings at once. It warns that changing everything at once may affect integrations or user access, and suggests changing settings individually and testing in a sandbox. You can import a custom baseline, and Security Center is an add-on for multiple orgs. Test it in a sandbox first.
How much does a paid health check cost?
Prices in my sources come from vendors and are mostly unsourced. A consulting firm lists ranges of $3,000 to $8,000, $8,000 to $20,000 and over $30,000 depending on depth. A tool vendor lists managed services from $3,500 a month. I verified none of these. Get written quotes that state scope, what’s measured, how findings are ranked and what you receive, and compare them with what the free tools already show.
How often should I run a health check?
Sources disagree, and none give a basis. An agency suggests every 2 to 3 years for simpler orgs and a lighter check yearly for complex ones, and another says at least once a year. I’d tie the cadence to your risk: yearly for orgs with guest sites, regulated data or many integrations, with an extra check after any acquisition, major release or large integration. Document the reasoning. Write the reasoning down for later.
Can I trust the percentages vendors publish?
Treat them as claims. Several have no source, such as inactive-license and duplicate-rate ranges, and others come from vendor-run surveys without a described method. A larger sample isn’t automatically better, since orgs that buy audits or tools aren’t a random draw. Ask who was in the sample, how a failure was defined and when it was measured. Then check the same thing in your own org. Keep a note of each figure’s source.