

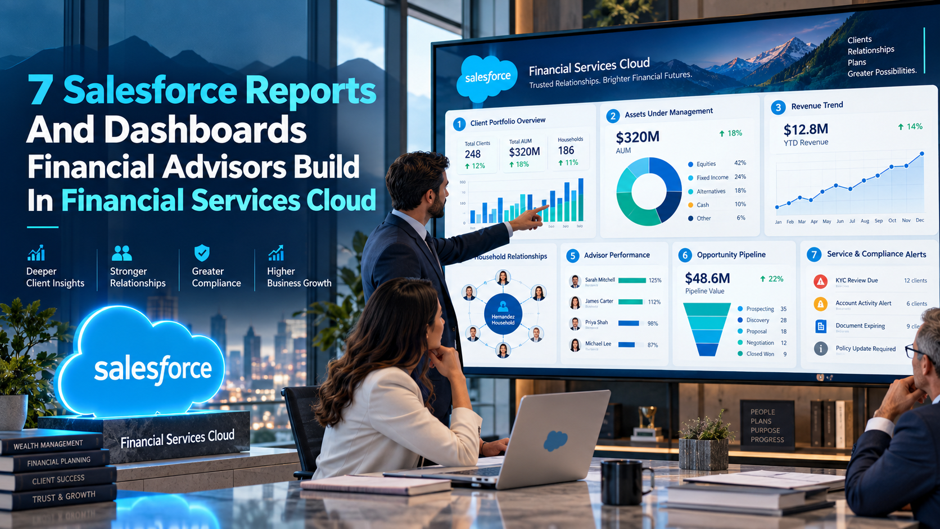
An advisor pulls up their book of business on a Monday morning wanting a simple answer to a genuinely important question: which top-tier household hasn’t had a portfolio review in the last 90 days. In a generic CRM, answering that requires manually cross-referencing a client list against a calendar and hoping nothing gets missed. In Salesforce Financial Services Cloud, that same question resolves in seconds, because the platform’s household, financial account, and review-cadence objects were purpose-built to make exactly this kind of relationship-driven reporting possible in the first place.
Financial Services Cloud extends standard Sales Cloud with the specific data model wealth management actually runs on: households instead of generic accounts, financial accounts instead of generic opportunities, and goals and referrals tracked as first-class objects rather than custom workarounds. That foundation is what makes a genuinely distinct set of reports and dashboards possible, ones a standard CRM simply can’t produce without extensive custom build. This guide works through the 7 reports and dashboards financial advisors consistently build inside Financial Services Cloud, what each one actually captures, and why the underlying data model makes them meaningfully more useful than anything a generic Sales Cloud deployment could offer out of the box.
TL;DR
| Report or dashboard | What it helps an advisor actually do |
| 1. Household AUM and net worth view | See a complete, rolled-up financial picture across every member of a household, not just a single client record |
| 2. Client segmentation and tiering report | Prioritize time and attention based on AUM tier, engagement level, and lifetime value rather than gut feel |
| 3. Portfolio review cadence dashboard | Catch overdue reviews automatically, before a top-tier client notices the gap themselves |
| 4. Pipeline and revenue forecast dashboard | Forecast revenue across AUM, deposits, policies, and deal pipeline with a live, rolled-up view |
| 5. Compliance and audit trail report | Maintain visibility into KYC status, suitability reviews, and compliance exceptions in one place |
| 6. Referral network and relationship map | Track referral sources and the full web of relationships surrounding a household, including trustees and outside professionals |
| 7. Advisor productivity and book-of-business dashboard | Measure AUM growth, client satisfaction signals, and business development effectiveness across an advisor’s entire book |
The thread connecting every row above: these 7 reports genuinely exist specifically because Financial Services Cloud’s underlying data model, households, financial accounts, goals, and referrals as native objects, gives advisors something meaningful to report on that a generic CRM’s contacts and opportunities simply weren’t built to capture in the first place.
Why FSC’s Data Model Makes This Reporting Possible in the First Place
Before working through the 7 specific reports in genuine, careful detail, it’s worth understanding exactly why Financial Services Cloud produces meaningfully different reporting than standard Sales Cloud, since the distinction traces directly back to the underlying object model each platform was actually built around from the start.
The Specific Objects That Make Advisor-Grade Reporting Possible
The core data model differences that separate Financial Services Cloud from a generic CRM deployment:
- The Household object models complex family structures directly, including spouses, children, beneficiaries, trustees, and external parties like CPAs and attorneys, rather than treating each person as an isolated, disconnected record
- The Financial Account object represents an actual investment or banking account tied to a specific household member, carrying balance, type, and product details a generic Opportunity object was never built to hold
- Goals exist as their own dedicated object, letting an advisor track a client’s actual financial objectives, retirement timing, education funding, and measure progress against them directly
- Referrals get tracked as a first-class relationship type, capturing not just that a referral happened but the full context of who referred whom and through which relationship
Why This Object Model Directly Enables Relationship-Based Reporting Rather Than Purely Transactional Reporting
Financial services operates on long-term trusted relationships rather than short-term transactions, and advisors need to understand households, life events, financial goals, and product portfolios across years or even decades, a fundamentally different reporting need than the deal-stage and close-date reporting a standard sales pipeline was originally built around.
Why Firms Moving From Generic CRM to FSC Consistently Notice This Difference Immediately
Firms that migrate from spreadsheets or a generic CRM to Financial Services Cloud typically see measurably faster client onboarding and clearer visibility into their book of business almost immediately, a direct result of finally having objects genuinely built around how advisory relationships actually work, rather than objects borrowed from a transactional sales process.
Report 1: The Household AUM and Net Worth View
The very first and arguably most foundational report advisors genuinely build in Financial Services Cloud rolls up every single financial account across an entire household into one complete, unified financial picture that’s genuinely worth trusting and relying on every single day of the year, without exception.
What This Report Actually Displays
| Element | What it shows |
| Total household AUM | A single, aggregated figure combining every financial account across every household member into one number |
| Net worth summary | A broader picture extending beyond managed assets alone to reflect the household’s genuine overall financial position |
| Multi-generational relationships | Visibility into how accounts and beneficiaries connect across parents, children, and even grandchildren within the same household |
| Account-level breakdown | The ability to drill from the household total down into individual accounts, types, and specific balances |
Why Rolling Up to the Household Level Changes How Advisors Actually Prioritize Their Time
A client who individually holds a modest account balance can represent a considerably larger, more strategically important relationship once their spouse’s accounts, a trust, and adult children’s accounts are all genuinely factored into the same household total, meaning household-level rollup reporting frequently reveals priority relationships a purely individual-account view would miss entirely.
Why This Report Specifically Depends on FSC’s Household Object
Building this exact rollup inside a generic CRM would require extensive custom object work to model family relationships and aggregate balances correctly, work Financial Services Cloud’s native Household object already handles, making this report considerably faster to stand up on FSC than on a platform never built with household relationships in mind.
Report 2: Client Segmentation and Tiering
The specific segmentation dimensions advisors commonly build into this report to prioritize their book of business deliberately, rather than reactively:
- AUM tier segmentation, grouping households into defined bands, such as top-tier, core, and emerging, based on total assets under management
- Engagement level scoring, reflecting how recently and how frequently a household has actually interacted with the advisor or firm
- Lifetime value estimation, projecting a household’s genuine long-term value to the practice beyond simply its current AUM snapshot
- Life-stage and goal-based segmentation, grouping households by where they genuinely sit relative to major financial goals like retirement or education funding
Why Segmentation Rules Built Directly Into FSC Drive Automated Prioritization
Financial Services Cloud lets advisors build segmentation rules that automatically prioritize tasks, reviews, and outreach based on these exact tiers, meaning a top-tier client without a portfolio review in the last 90 days gets flagged proactively, before the advisor has to notice the gap manually themselves.
Why This Report Represents the Shift From Reactive to Strategic Book Management
Segmentation reporting is precisely what genuinely separates an advisor managing their entire book reactively, responding only when a client happens to reach out on their own initiative, from one managing it strategically, proactively directing attention toward the specific households and moments that genuinely warrant it most.
Report 3: Portfolio Review Cadence Dashboard
| Element | What it tracks |
| Review due dates by tier | Displays exactly when each household’s next scheduled review is due, calibrated to the review frequency appropriate for its specific segment |
| Overdue review flags | Surfaces any household that has crossed its expected review window without a completed review on record |
| Completed review history | Maintains a genuine historical log of past reviews, supporting both service consistency and compliance documentation |
| Upcoming review workload | Gives an advisor or team a forward-looking view of review volume across the coming weeks, supporting genuine capacity planning |
Why Automated Cadence Tracking Prevents a Genuinely Common Service Failure
Missing a scheduled review for a top-tier client represents one of the more damaging, avoidable service failures an advisory practice can experience, since it directly signals inattention to precisely the relationship a firm can least afford to neglect, making automated, tier-based cadence tracking a genuinely high-value report despite its relatively simple underlying structure.
Why This Dashboard Works Best When Tightly Connected to the Segmentation Report
This dashboard delivers its full value specifically when tied directly to the segmentation tiers covered in Report 2, since review frequency genuinely should differ by tier, a top-tier household might warrant quarterly reviews while an emerging one might reasonably need only an annual check-in, and building that differentiated cadence logic directly into the dashboard keeps the review schedule realistic and genuinely sustainable for the advisor’s own capacity.
Report 4: Pipeline and Revenue Forecast Dashboard
The specific revenue streams advisors commonly consolidate into a single forecasting view inside Financial Services Cloud:
- Assets under management growth, tracking both organic growth from existing accounts and net new AUM from referrals and new client relationships
- Deposit and banking product pipeline, relevant specifically for advisors operating within a broader bank or credit union wealth management practice
- Insurance policy pipeline, tracking in-progress policy applications and their expected revenue contribution once bound
- Fee-based and commission-based revenue projections, reflecting the specific compensation structure a given advisory practice actually operates under
Why AI-Driven Forecasting Specifically Matters for the Complexity Financial Services Introduces
Financial services revenue forecasting genuinely involves considerably more complexity than a standard sales pipeline, spanning deposits, policies, AUM, and deal pipelines simultaneously, and Financial Services Cloud’s AI-driven forecasting and live rollups are specifically built to handle that complexity rather than forcing every revenue type into a single, generic opportunity stage model.
Why This Dashboard Gives Practice Leadership Genuine Visibility Beyond Any Single Advisor
Sales leaders and practice managers genuinely benefit from real-time visibility into team performance, pipeline health, and capacity across branches, agencies, or individual advisory practices, letting leadership genuinely balance workload and drive accountability across a team rather than relying purely on each individual advisor’s own self-reported pipeline status.
Report 5: Compliance and Audit Trail Report
| Compliance element | What the report captures |
| KYC documentation status | Centralized visibility into know-your-customer documentation completeness across every household in an advisor’s book |
| Suitability review tracking | Status of automated workflows managing investment suitability reviews and their required approvals |
| Exception management | Flagging and tracking of any compliance exception, along with automated escalation where a specific exception requires it |
| Complete audit trail | A full, timestamped log of client interactions, account changes, and system activity supporting genuine regulatory defensibility |
Why Compliance Reporting in FSC Genuinely Differs From a Bolt-On Compliance Add-On
Compliance is non-negotiable in wealth management, and Financial Services Cloud provides these specific capabilities as native platform tooling rather than a separate, bolted-on module, meaning compliance data lives directly alongside the same household and financial account records an advisor already works with daily, rather than in a disconnected system requiring separate reconciliation.
Why Field-Level Audit Trail Capability Specifically Matters for Regulatory Defensibility
Beyond standard setup audit trail tracking alone, deeper field-level historical retention and auditing capability supports the kind of granular, genuinely defensible record regulators actually expect during a genuine examination, confirming precisely what changed, exactly when, and by whom across every single client-facing record in the system.
Report 6: Referral Network and Relationship Mapping
The specific relationship dimensions this report captures, extending well beyond a household’s own immediate members:
- Referral source tracking, capturing not just that a referral occurred but the specific relationship through which it happened, an existing client, a centers-of-influence relationship, or a professional partner
- External professional relationships, mapping the CPAs, attorneys, and other outside professionals connected to a given household who may themselves become future referral sources
- Trustee and beneficiary relationships, extending the household picture beyond the immediate family into the fuller web of people with a genuine financial stake in the relationship
- Referral conversion and value tracking, connecting a given referral back to the eventual AUM or revenue it produced, supporting genuine ROI measurement on referral-generation efforts
Why Relationship Mapping Represents a Genuinely Distinct Reporting Category From Household Rollups Alone
While the household report covered earlier focuses specifically on rolling up financial data within a family unit, this report specifically maps the broader relationship network surrounding that household, the professionals, referral sources, and connected parties who genuinely influence the relationship without necessarily being direct account holders themselves at all.
Why This Report Directly Supports Deliberate, Strategic Referral Generation
Advisors who can genuinely see precisely which relationships have historically generated the strongest referrals, whether specific centers of influence or particular existing clients, can deliberately invest more relationship-building time in those specific connections, rather than treating referral generation as a purely passive, hope-based activity left entirely to chance.
Report 7: Advisor Productivity and Book-of-Business Dashboard
| Metric category | What it reveals about the practice |
| AUM growth trend | Tracks how total assets under management across an advisor’s book are trending over time, distinguishing organic growth from new client acquisition |
| Client satisfaction signals | Surfaces indicators of relationship health, drawing on review completion, engagement frequency, and any recorded client feedback |
| Advisor productivity metrics | Measures activity and output against the advisor’s actual book size, supporting fair, meaningful performance comparison across a team |
| Business development effectiveness | Evaluates how well prospecting and referral-generation efforts are actually converting into new AUM and revenue |
Why This Dashboard Functions as the Genuine Capstone View Across Everything Else Covered
This final dashboard pulls together signals from nearly every other report covered throughout this guide, household AUM, segmentation, review completion, pipeline, and referral conversion, into a single, comprehensive view of how an advisor’s entire practice is genuinely performing, rather than requiring leadership to piece that picture together manually across several separate reports.
Why Advanced Analytics Specifically Matter for Surfacing Trends a Simple Report Would Miss
Advanced analytics built directly into this dashboard reveal genuine trends in AUM, client satisfaction, advisor productivity, and business development effectiveness that a simple, static snapshot report simply wouldn’t surface, giving practice leadership genuine, forward-looking insight rather than only a backward-looking summary of what has already happened.
What Makes These Reports Genuinely Different From Standard Sales Cloud Reporting
Having walked through all 7 reports individually and in genuine, careful detail throughout this guide, it’s genuinely worth stepping back at this specific point to understand precisely why they represent something meaningfully different from what a standard Sales Cloud reporting setup could genuinely produce entirely on its own.
The Core Distinctions Worth Understanding
| Standard Sales Cloud reporting | Financial Services Cloud advisor reporting |
| Built around Accounts, Contacts, and Opportunities | Built around Households, Financial Accounts, Goals, and Referrals as native, purpose-built objects |
| Optimized for deal-stage and close-date tracking | Optimized for long-term relationship health, review cadence, and multi-generational household context |
| Requires extensive custom object work for family relationship modeling | Comes with native household relationship modeling already built into the platform |
| Compliance reporting typically requires separate tooling | Compliance capability, KYC, suitability, audit trails, lives natively alongside client data |
Why This Distinction Matters Directly for Any Advisory Firm Evaluating Its Own Reporting Setup
A firm currently running standard Sales Cloud, or an even more generic CRM, and attempting to replicate these 7 reports faces considerably more custom development work than a firm building the same reports on Financial Services Cloud’s native object foundation, since much of the underlying data modeling these reports depend on already exists natively within FSC rather than needing to be built entirely from scratch.
A Practical Sequence for Building These Reports
Rather than attempting to build all 7 reports simultaneously and entirely all at once from the very start of an implementation, most advisory practices genuinely benefit considerably from a deliberate, carefully staged sequence instead, built out steadily and deliberately over an extended, reasonable period of time.
The Recommended Build Order
The sequence that tends to produce the strongest, most immediately useful reporting foundation:
- Starting with the household AUM and net worth view, since nearly every other report on this list ultimately depends on having accurate, genuinely complete household-level data already in place
- Building client segmentation next, since tiering the book of business informs how every subsequent report, particularly review cadence, should genuinely be calibrated and weighted
- Adding the portfolio review cadence dashboard once segmentation exists, connecting review frequency directly to the tiers already established in the prior step
- Layering in compliance and audit trail reporting early as well, given how foundational and non-negotiable this capability genuinely is for any advisory practice operating under regulatory oversight
- Building the pipeline, referral, and advisor productivity dashboards last, since these benefit considerably from the underlying household, segmentation, and review data already being genuinely reliable by that point
Why Household Data Quality Deserves Genuine Priority Before Building Any Report on Top of It
Every one of these 7 reports ultimately depends on genuinely accurate, complete household and financial account data, meaning investing in data quality and proper household relationship mapping before building reports on top of that foundation consistently produces considerably more reliable, trustworthy reporting than building reports first and hoping the underlying data quality catches up later.
Matching Each Report to the Right Audience Inside the Firm
Beyond understanding what each individual report actually contains on its own, being genuinely deliberate about exactly who inside an advisory practice genuinely needs regular access to each one meaningfully improves how effectively these reports actually get used day to day across the entire firm and organization.
The Typical Audience for Each Report Category
The specific stakeholders who most commonly rely on each report or dashboard covered throughout this guide:
- Individual advisors depend most directly on their own household AUM view, segmentation tiers, and review cadence dashboard, since these directly inform their daily prioritization decisions across their own specific book
- Compliance officers and operations teams rely most heavily on the compliance and audit trail report, needing broad visibility across every advisor’s book rather than just their own individual portfolio
- Practice leadership and managing partners depend most on the pipeline forecast and advisor productivity dashboards, using these specifically to evaluate overall practice health and individual advisor performance across the team
- Business development and marketing functions draw most directly on the referral network and relationship mapping report, using it to identify and invest in the specific relationships generating the strongest referral activity
Why Overly Broad Access to Every Report Can Genuinely Undermine Their Usefulness
Giving every user in the firm unrestricted access to every report, rather than genuinely tailoring access to what each specific role actually needs, tends to produce a cluttered, overwhelming reporting environment where advisors struggle to quickly locate the specific view relevant to their own daily work, undermining much of the genuine value well-designed, focused reporting was originally meant to provide.
Why Role-Based Access Also Directly Supports Genuine Compliance Requirements
Beyond simple usability concerns alone, role-based access to these reports also supports genuine compliance and data governance requirements, since not every team member genuinely needs, or genuinely should have, visibility into every other advisor’s full book of business, particularly compensation-sensitive productivity data or genuinely sensitive compliance exception details.
How AI Is Changing What These Dashboards Can Actually Do
Beyond the core 7 reports themselves already covered throughout this guide, it’s genuinely worth understanding how AI-driven capability layered directly on top of Financial Services Cloud is beginning to change what these dashboards can genuinely surface, moving well beyond simple historical summaries into more forward-looking, genuinely useful guidance.
The Specific AI Capabilities Now Appearing Alongside These Reports
| AI capability | How it enhances the underlying report |
| AI-powered lead scoring | Helps advisors focus specifically on the highest-value prospects and relationship expansion opportunities within their existing book |
| Next-best-action recommendations | Surfaces specific, recommended actions directly in context, rather than leaving an advisor to interpret raw dashboard data unassisted |
| AI-driven meeting preparation | Helps advisors prepare for client meetings by summarizing household context, gathering relevant notes, and reducing manual meeting administration |
| AI-driven revenue forecasting | Improves the accuracy of the pipeline and revenue forecast dashboard specifically by accounting for patterns a purely manual projection would likely miss |
Why AI-Driven Meeting Preparation Specifically Reduces the Administrative Burden Around These Reports
A meeting-preparation capability that automatically summarizes client and household context, gathers relevant notes, and helps plan follow-up genuinely reduces the manual work an advisor would otherwise spend piecing together the same information from several of the reports already covered throughout this guide, freeing more of their actual time for the relationship and advice work that genuinely matters most.
Why This AI Layer Still Depends Entirely on the Underlying Data Quality Already Covered
Every one of these AI capabilities depends entirely on the same underlying household, financial account, and interaction data the 7 core reports already rely on, meaning firms with genuinely clean, well-maintained data see considerably stronger AI-driven insight than firms attempting to layer AI on top of an incomplete or poorly maintained data foundation.
Common Mistakes When Building These Reports in FSC
Beyond understanding the 7 report types themselves in isolation from one another, several recurring, genuinely predictable mistakes show up consistently among firms building out this kind of reporting, and avoiding these specific mistakes meaningfully improves the odds of a genuinely useful, widely adopted reporting suite overall.
Building reports before genuinely cleaning up household and financial account data. A household rollup report built on incomplete or inaccurate underlying data produces misleading totals that quickly erode advisor trust in the entire reporting system, regardless of how well-designed the report itself actually is.
Treating segmentation as a one-time setup rather than an ongoing discipline. Client tiers shift as AUM grows, life events occur, and relationships evolve, and segmentation rules left unreviewed for an extended period gradually drift out of alignment with the book’s actual current composition.
Building compliance reporting as an afterthought rather than a foundational priority. Given how genuinely non-negotiable compliance requirements are in wealth management, treating this reporting category as a lower priority than revenue-facing dashboards risks a genuine regulatory gap that’s considerably more costly to address after the fact.
Overloading a single dashboard with every possible metric rather than focusing each report on a specific decision. A dashboard trying to answer every possible question at once typically ends up helping advisors answer none of them quickly, making focused, decision-specific report design considerably more valuable than comprehensive but unfocused reporting.
Failing to connect referral and productivity reporting back to the underlying household and segmentation data. As covered earlier, the advisor productivity dashboard specifically depends on strong underlying data from several other reports, and building it in isolation from that foundation limits how genuinely useful it can actually become.
FAQs
Do all 7 of these reports require Financial Services Cloud specifically, or could some be built in standard Sales Cloud?
Several individual elements could technically be approximated in standard Sales Cloud with extensive custom object work, but the household rollup, financial account modeling, and native compliance tooling that make these reports genuinely efficient to build and maintain are specifically native to Financial Services Cloud, meaning replicating the full suite on standard Sales Cloud would require considerably more custom development effort.
How long does it typically take an advisory practice to build out this full suite of reports? This varies based on data quality and existing FSC configuration, but firms following the staged sequence covered earlier, starting with household data quality before building reports on top of it, commonly see the core reports functioning well within a matter of weeks, with the more advanced productivity and referral analytics maturing over a somewhat longer period as underlying data accumulates.
Should every advisor within a practice have access to all 7 reports, or should access vary by role?
Access should genuinely vary by role in most practices, with individual advisors typically needing direct access to their own household, segmentation, and review cadence reports, while practice leadership and compliance teams need broader visibility across the full book, including the advisor productivity and compliance audit trail reports that individual advisors don’t necessarily need to see in full.
How often should client segmentation tiers actually be recalculated?
Given how directly AUM, life events, and engagement patterns shift over time, a quarterly review of segmentation tiers represents a reasonable baseline for most practices, though firms experiencing rapid growth or significant market volatility may benefit from reviewing tiers somewhat more frequently to keep the underlying prioritization genuinely accurate.
Can these reports genuinely help with the coming generational wealth transfer many advisory practices are preparing for?
Yes, and the household relationship mapping covered throughout several of these reports specifically supports this preparation, since understanding multi-generational relationships, beneficiaries, and the full web of family connections within a household gives an advisor genuine visibility into exactly where and how a coming wealth transfer will likely flow within their own book.
Does building these reports require a dedicated Salesforce administrator, or can an advisor build them independently?
Most advisory practices genuinely benefit from at least some dedicated administrative support, particularly for the initial household data modeling and compliance reporting setup, though many of the reports themselves, once the underlying data foundation is solid, can be built and adjusted by a reasonably capable administrator without requiring extensive custom development expertise.
What’s the biggest risk of skipping the household-level foundation and building segmentation or pipeline reports first?
The biggest risk is building an entire reporting suite on top of an unreliable data foundation, meaning segmentation tiers, review cadences, and pipeline forecasts all end up reflecting incomplete or inaccurate household data, a problem that typically requires revisiting and rebuilding much of the subsequent reporting work once the underlying household data finally gets properly cleaned up.
Do these reports work equally well for a solo advisor practice as for a large multi-advisor firm?
The core report structures apply regardless of practice size, though a solo advisor typically needs a considerably lighter version focused primarily on their own household, segmentation, and review cadence views, while a larger multi-advisor firm genuinely needs the fuller suite, including practice-level productivity and compliance oversight reporting, to manage visibility and accountability across an entire team of advisors working within the same book.
How should a firm handle reporting for households that span multiple advisors, such as a couple each working with a different relationship manager?
Financial Services Cloud’s household object genuinely supports this scenario directly, since the household record itself can connect to multiple advisors while still maintaining a single, unified financial picture, meaning the household AUM report can display the complete relationship even when responsibility for different accounts or family members is genuinely split across more than one advisor within the same firm.